
GeoAI Martian
Challenge
News |
What is the Challenge
The goal of the GeoAI Object Detection Challenge is to broaden the participation of, but not limited to, students and early career scholars in geospatial sciences, computer science, Earth and space sciences, data science, and fields relevant to this exciting research community. The focus of our 2022 GeoAI challenge is Mars crater detection, so we named it a GeoAI Martian Challenge. This is to celebrate the anniversary of the successful landing of the Mars Perseverance rover on the red planet on February 18, 2021. We hope this event will promote the applications of cutting-edge AI technology to planetary and geospatial sciences, contribute to the exploration of future human life in space, and allow us to bring this experience back to Earth to study the changing environment of our living planet.
In this object detection challenge, we have prepared Mars crater benchmark datasets that contain over 100,000 images and 300,000 craters located in nearly every corner of the Mars surface. Our goal is to encourage participants to develop novel GeoAI models for detecting the locations of craters on each image.
Read welcoming words from Professor Wenwen Li here.
Collaborators
{{p.name}}
{{p.affil}}
(TBD)
Partners
Hosts
Research Paper
Dataset Examples
 |
 |
 |
 |
 |
 |
Dataset Overview
The Mars crater image dataset assembles a total of 102,675 images extracted from a Mars global mosaic (Edwards et al., 2011). The mosaic consists of Mars Odyssey Thermal Emission Imaging System (THEMIS) daytime infrared (DIR) data with 100 m resolution and global coverage ( source ). Each image is with a size of 25.6 km x 25.6 km (256 x 256 pixels). All craters in the images are annotated with instance-level bounding boxes utilizing the Mars impact crater catalog (Robbins and Hynek, 2012). The catalog contains over 640,000 craters with positional, morphologic and morphometric data. It was compiled by multiple manual searches on both infrared imagery and topographic data. In this challenge, the images are split into three sets: training, validation and testing. 1000 images are randomly selected as the validation set and the rest is evenly distributed into the training and testing sets. The images are carefully sampled such that the training and testing datasets have the same spatial location distribution on the Mars surface.

Reference
"Edwards, C. S., et al. "Mosaicking of global planetary image datasets: 1. Techniques and data processing for Thermal Emission Imaging System (THEMIS) multi-spectral data." Journal of Geophysical Research: Planets 116.E10 (2011)". URL: https://doi.org/10.1029/2010JE003755
.Robbins, Stuart J., and Brian M. Hynek. "A new global database of Mars impact craters ≥ 1 km: 1. Database creation, properties, and parameters." Journal of Geophysical Research: Planets_117.E5 (2012). URL: https://doi.org/10.1029/2011JE003966
Dataset Generation
To generate the crater dataset from the Mars mosaic and the crater catalog, we follow the steps in our work (Hsu et al., 2021). We extract non-overlapping image samples from the global mosaic. We also adopt strategies for distortion correction and to handle trimmed craters. For more details, please refer to Hsu et al. (2021). Overall, the mosaic could produce 220,956 images and we retain 102,675 of them, because the remainder contain either no craters or craters that are unable to be recognized visually, or both. The total number of craters in the filtered dataset is 301,912. The smallest crater is 0.2 km (2 pixels) in diameter and the largest crater is 25.5 km (255 pixels) in diameter (There are only a few of these edge cases). The resulting training dataset contains 50,838 images with 149,560 craters, the testing set contains 50,837 images with 149,389 craters, and the validation set contains 1,000 images with 2,963 craters.
Reference
Hsu, Chia-Yu, Wenwen Li, and Sizhe Wang. "Knowledge-Driven GeoAI: Integrating Spatial Knowledge into Multi-Scale Deep Learning for Mars Crater Detection." Remote Sensing 13.11 (2021): 2116. URL: https://www.mdpi.com/2072-4292/13/11/2116.
Samples and Statistics
Dataset Samples
|
|
|
|
|
|
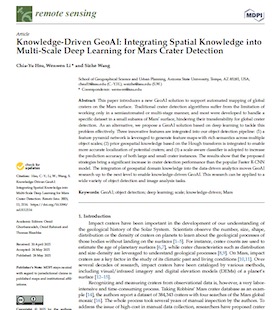
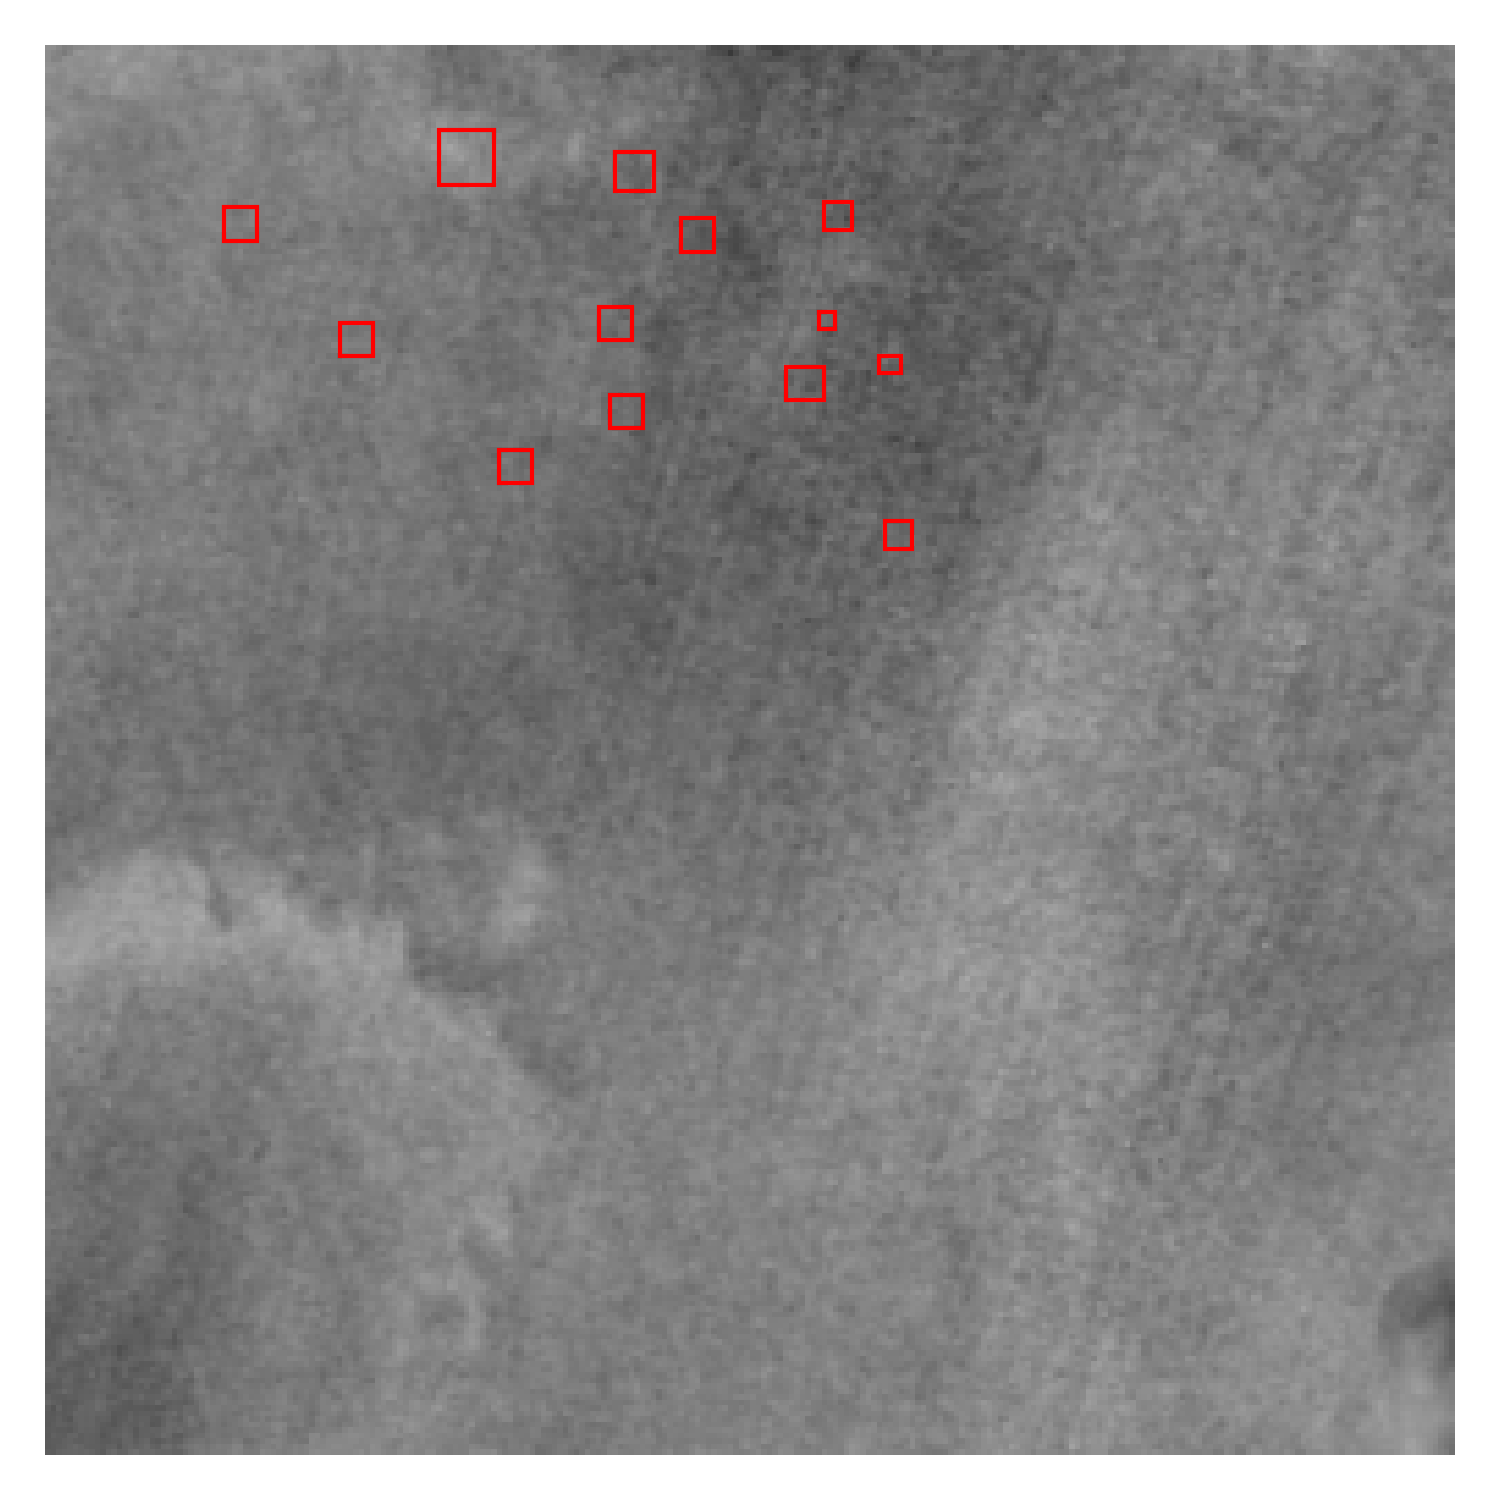
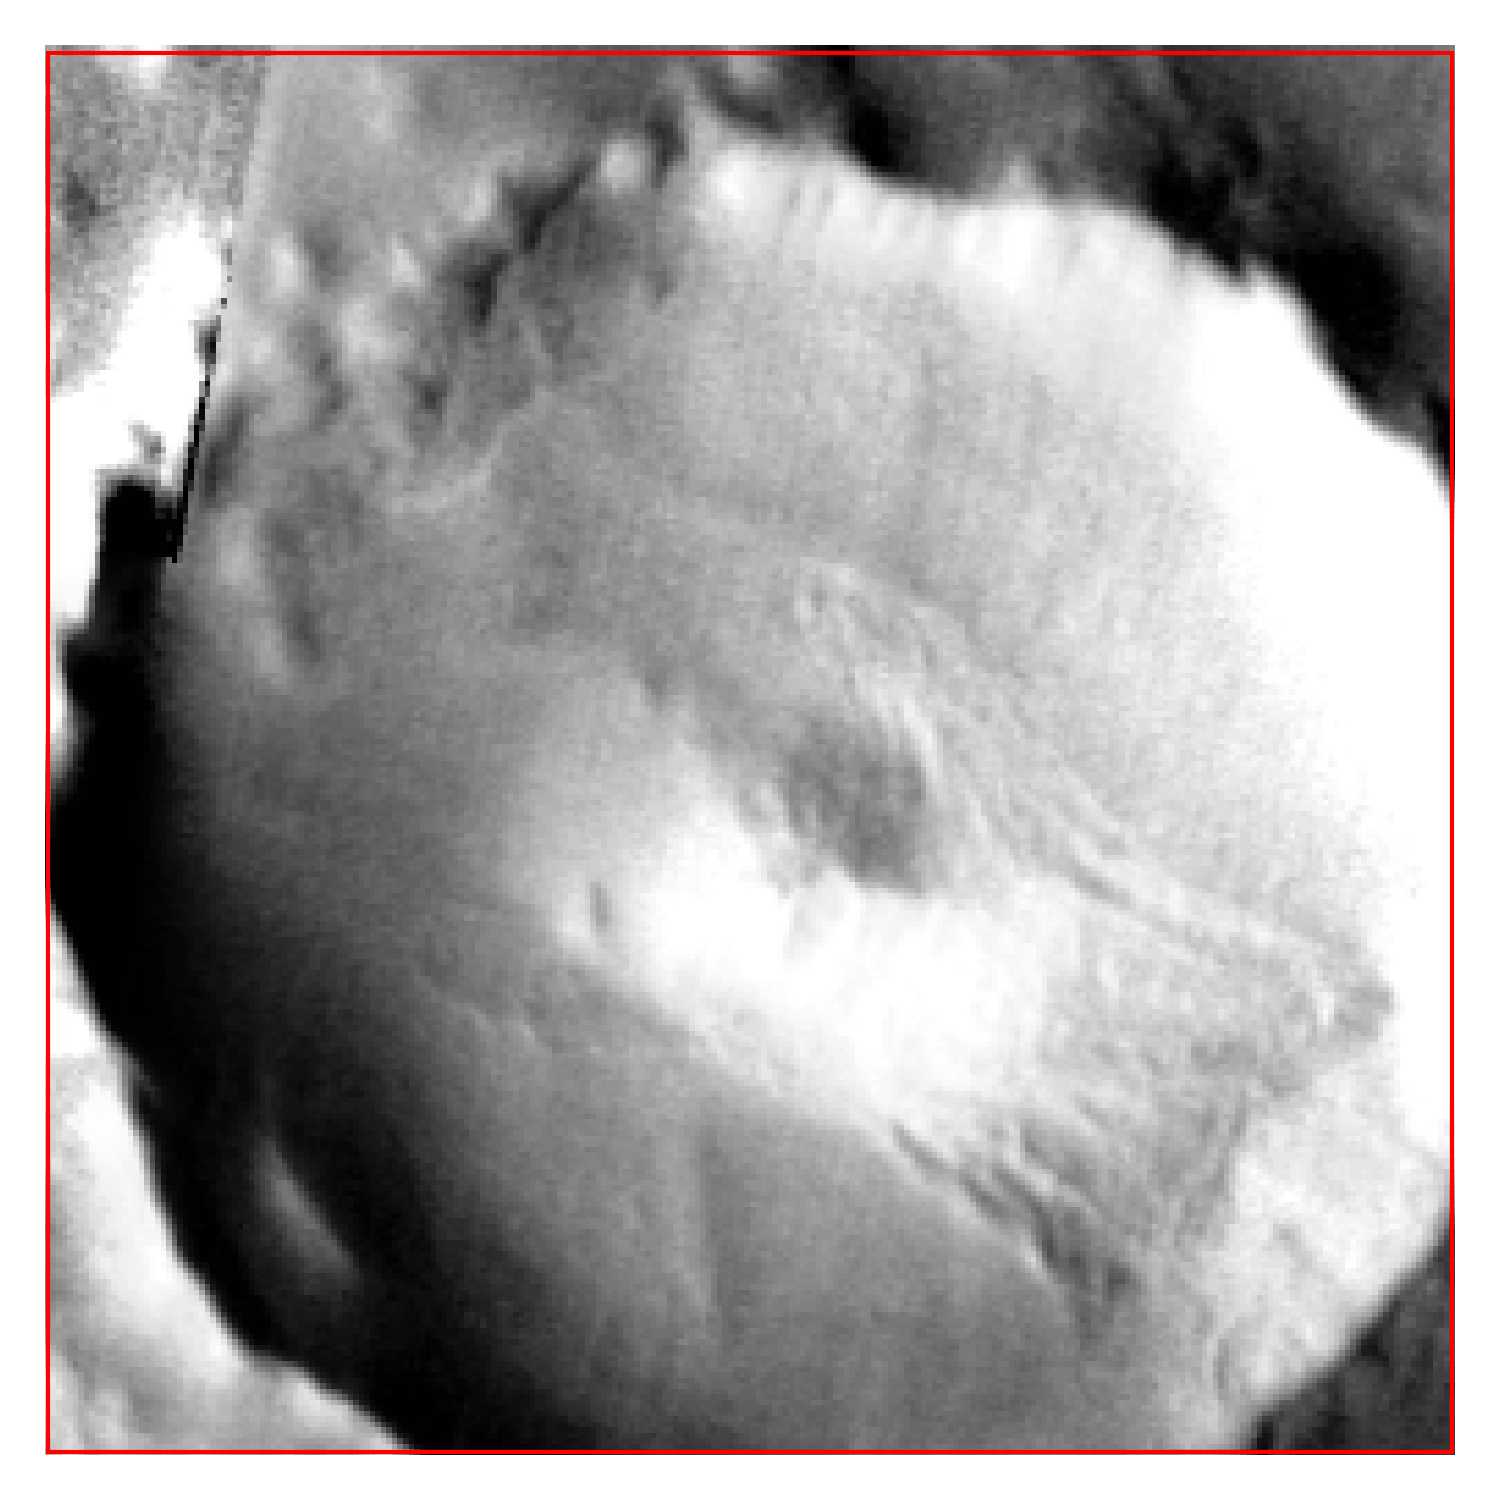
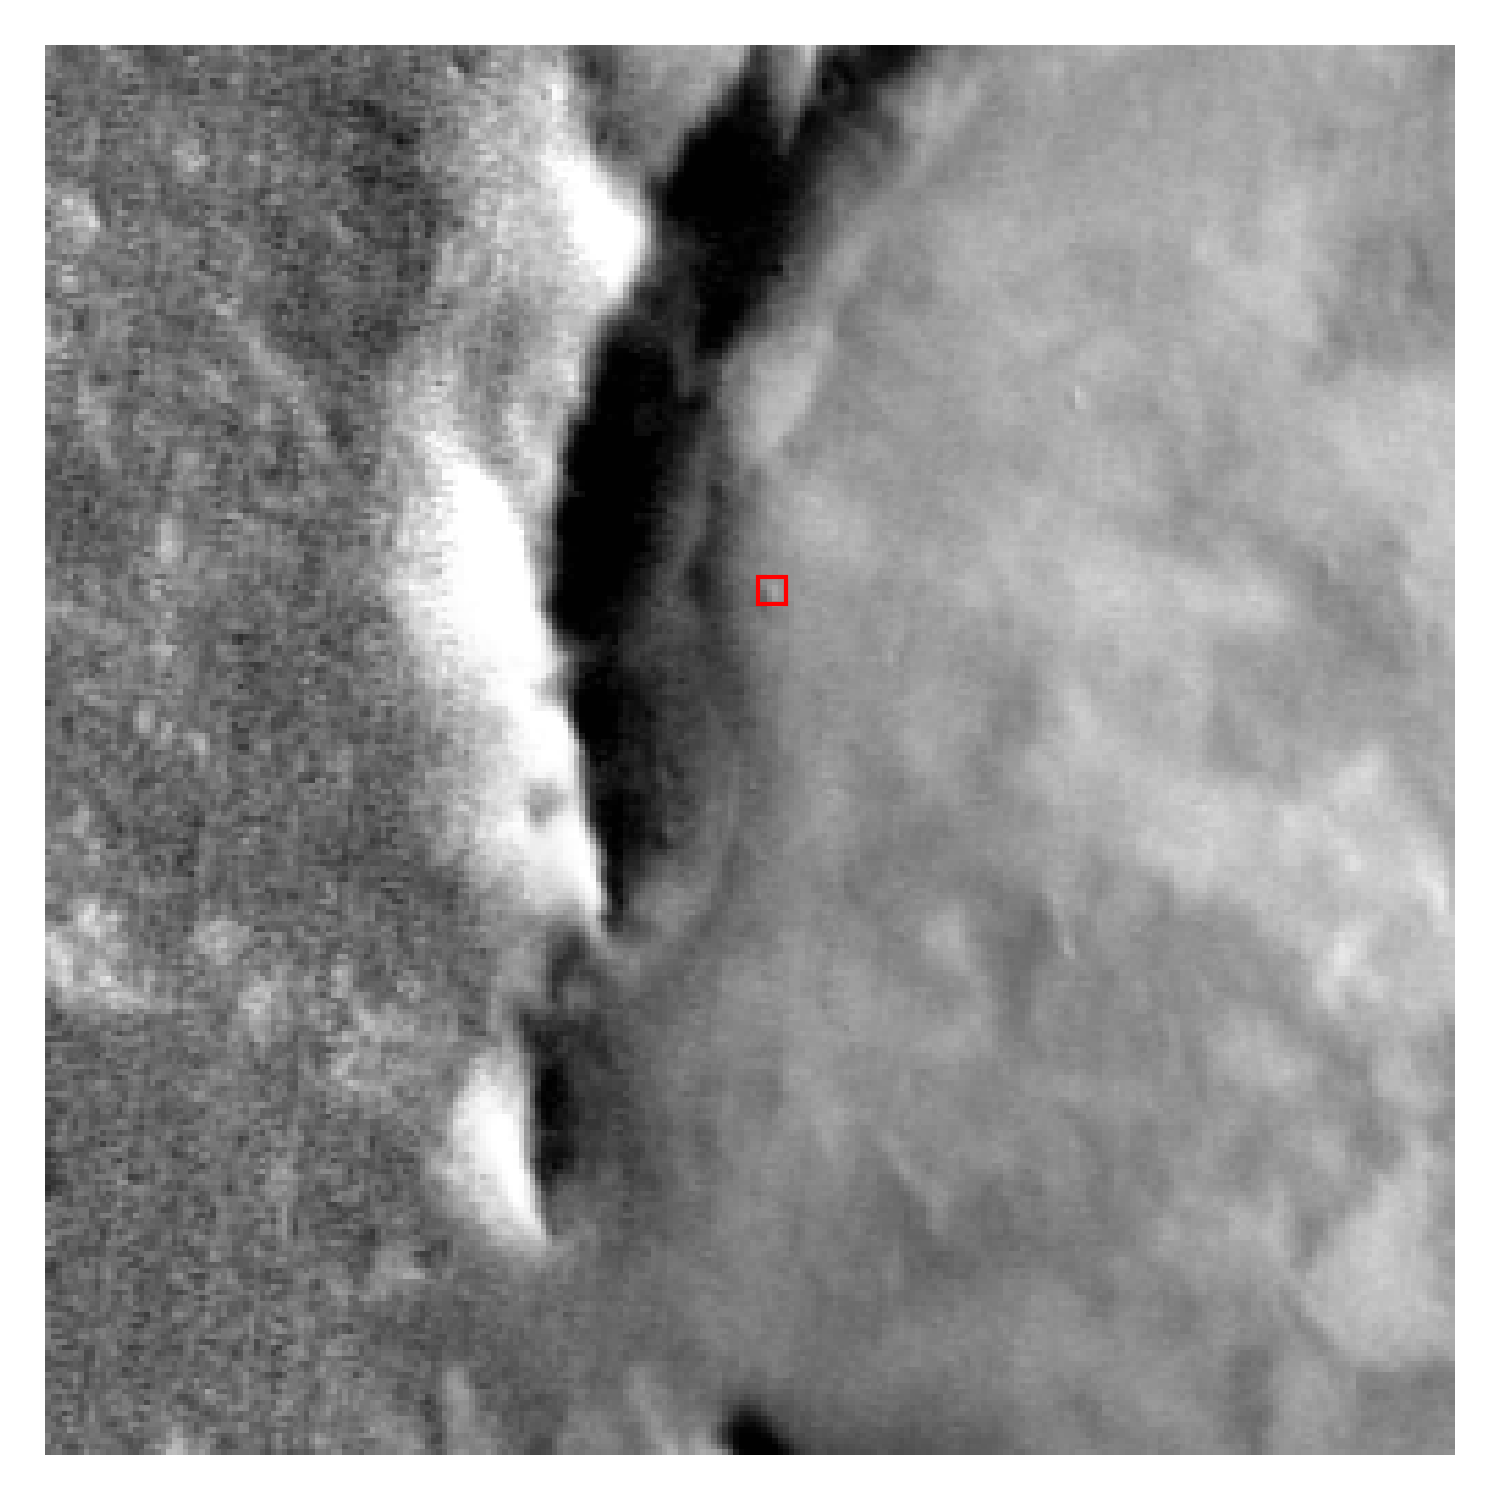
The above figures list a few example images in our datasets. There are very small (a few pixels in its diameter, see Figure (a)) to very large ones (see Figure (b)). They can be very sparsely or densely distributed on the Mars surface (see Figure (c) and (d)). Some craters may have overlapping boundaries or contain each other (Figure (e)). They could also appear in different types of terrains (Figure (f)).
Crater Count per Image Distribution
Crater Size Distribution
The above two figures demonstrate that most images contain only a few craters and the craters are relatively small compared to the image size. It raises a challenge for participants to find desired features in sparse scenes. On the other hand, there are also images with large-size craters. Therefore, we separate craters into three groups, small, medium and large, based on their sizes. By evaluating the detection performance in the three groups separately, we can better assess the model robustness. The small group contains 115,871 (38%) craters with diameters from 200 to 1km (2-10 pixels). The medium group contains 172,251 (57%) craters with diameters from 1.1km to 5km (11 to 50 pixels). And the large group contains 13,790 (5%) craters with diameters from 5km to 25.5km (50 to 255 pixels).
Download
Dataset
The dataset can be downloaded through 2022 GeoAI Martian Challenge Dataset (4.3G). It contains all images, annotations of the training and validation sets, an evaluation program and challenge-related files. Please refer to Data Format for detailed introduction.
COCO API
The evaluation metrics used in this challenge follow the same metrics used in the COCO detection challenge with slight modification. Therefore, our evaluation program requires some functions in the COCO API. Participants should install COCO API using the following commands:
- pip package installer:
- Conda package installer:
- Build from source.
pip install pycocotools
conda install -c conda-forge pycocotools
Terms and Conditions
Website
The design of our website follows that of the COCO challenge (https://cocodataset.org), allowing participants who are familiar with other AI challenges to more easily navigate on our website. But the source code of our website is completely different from that of COCO. Both the COCO website and our website is licensed under Creative Commons Attribution 4.0 International License.
Software - Evaluation Tools
The evaluation code provided in this challenge was a modification from the COCO challenge. Original code has Copyright (c) 2015 by the COCO Consortium. Revised code has Copyright (c) 2021 by the ASU CICI lab. All rights reserved.
Redistribution and use software in source and binary form, with or without modification, are permitted provided that the following conditions are met:
- Redistributions of source code must retain the above copyright notice, this list of conditions and the following disclaimer.
- Redistributions in binary form must reproduce the above copyright notice, this list of conditions and the following disclaimer in the documentation and/or other materials provided with the distribution.
- Neither the name of the COCO Consortium nor the names of its contributors may be used to endorse or promote products derived from this software without specific prior written permission.
THIS SOFTWARE AND ANNOTATIONS ARE PROVIDED BY THE COPYRIGHT HOLDERS AND CONTRIBUTORS "AS IS" AND ANY EXPRESS OR IMPLIED WARRANTIES, INCLUDING, BUT NOT LIMITED TO, THE IMPLIED WARRANTIES OF MERCHANTABILITY AND FITNESS FOR A PARTICULAR PURPOSE ARE DISCLAIMED. IN NO EVENT SHALL THE COPYRIGHT OWNER OR CONTRIBUTORS BE LIABLE FOR ANY DIRECT, INDIRECT, INCIDENTAL, SPECIAL, EXEMPLARY, OR CONSEQUENTIAL DAMAGES (INCLUDING, BUT NOT LIMITED TO, PROCUREMENT OF SUBSTITUTE GOODS OR SERVICES; LOSS OF USE, DATA, OR PROFITS; OR BUSINESS INTERRUPTION) HOWEVER CAUSED AND ON ANY THEORY OF LIABILITY, WHETHER IN CONTRACT, STRICT LIABILITY, OR TORT (INCLUDING NEGLIGENCE OR OTHERWISE) ARISING IN ANY WAY OUT OF THE USE OF THIS SOFTWARE, EVEN IF ADVISED OF THE POSSIBILITY OF SUCH DAMAGE.
Software - Starting Kit
This code is developed by the ASU CICI lab. Copyright (c) 2021, ASU CICI lab. All rights reserved.
Redistribution and use software in source and binary form, with or without modification, are permitted provided that the following conditions are met:
- Redistributions of source code must retain the above copyright notice, this list of conditions and the following disclaimer.
- Redistributions in binary form must reproduce the above copyright notice, this list of conditions and the following disclaimer in the documentation and/or other materials provided with the distribution.
- Neither the name of the ASU CICI lab nor the names of its contributors may be used to endorse or promote products derived from this software without specific prior written permission.
THIS SOFTWARE AND ANNOTATIONS ARE PROVIDED BY THE COPYRIGHT HOLDERS AND CONTRIBUTORS "AS IS" AND ANY EXPRESS OR IMPLIED WARRANTIES, INCLUDING, BUT NOT LIMITED TO, THE IMPLIED WARRANTIES OF MERCHANTABILITY AND FITNESS FOR A PARTICULAR PURPOSE ARE DISCLAIMED. IN NO EVENT SHALL THE COPYRIGHT OWNER OR CONTRIBUTORS BE LIABLE FOR ANY DIRECT, INDIRECT, INCIDENTAL, SPECIAL, EXEMPLARY, OR CONSEQUENTIAL DAMAGES (INCLUDING, BUT NOT LIMITED TO, PROCUREMENT OF SUBSTITUTE GOODS OR SERVICES; LOSS OF USE, DATA, OR PROFITS; OR BUSINESS INTERRUPTION) HOWEVER CAUSED AND ON ANY THEORY OF LIABILITY, WHETHER IN CONTRACT, STRICT LIABILITY, OR TORT (INCLUDING NEGLIGENCE OR OTHERWISE) ARISING IN ANY WAY OUT OF THE USE OF THIS SOFTWARE, EVEN IF ADVISED OF THE POSSIBILITY OF SUCH DAMAGE.
Images
The images in the dataset are obtained from the global Mars mosaic of the work by "Edwards, C. S., et al. "Mosaicking of global planetary image datasets: 1. Techniques and data processing for Thermal Emission Imaging System (THEMIS) multi‐spectral data." Journal of Geophysical Research: Planets 116.E10 (2011)". and courtesy of the U.S. Geological Survey. We appreciate the authors and the U.S. Geological Survey Department of the Interior/USGS for providing the resource at no cost.
Labels
The crater labels in the dataset are from the work "Robbins, Stuart J., and Brian M. Hynek. "A new global database of Mars impact craters≥ 1 km: 1. Database creation, properties, and parameters." Journal of Geophysical Research: Planets_117.E5 (2012)". and courtesy of the U.S. Geological Survey. We appreciate the authors and the U.S. Geological Survey Department of the Interior/USGS for providing the resource at no cost.
Mars Crater Dataset in the Challenge
Any use of our Mars crater dataset and the starting kit please cite the paper: Hsu, Chia-Yu, Wenwen Li, and Sizhe Wang. "Knowledge-Driven GeoAI: Integrating Spatial Knowledge into Multi-Scale Deep Learning for Mars Crater Detection." Remote Sensing 13.11 (2021): 2116. The ASU CICI lab does not own the copyright of the images. Use of the images must abide by the USGS Terms of Use.
Welcome to the 2022 GeoAI Martian Challenge!
The 2022 GeoAI Martian Challenge is the very first in the series of GeoAI challenges hosted by the Cyberinfrastructure and Computational Intelligence Lab (CICI) and the Spatial Analysis Research Center (SPARC) of Arizona State University (ASU). This is a collaboration among researchers from multiple disciplines, organizations and sectors, including ASU, U.S. Geological Survey (USGS), Jet Propulsion Laboratory (JPL), Oak Ridge National Lab, Esri, Google and American Geographical Society. The goal of this object detection challenge is to broaden the participation of, but not limited to, students and early career scholars in geospatial sciences, computer science, Earth and space sciences, data science, and fields relevant to this exciting research community. Through this challenge, we also hope to form a strong research network to facilitate collaboration among researchers and practitioners from different disciplines to jointly promote cutting-edge GeoAI research and education, as well as their translational solutions to problems in a wide range of environmental and social science domains. Virtual hands-on training sessions on designing and developing AI and deep learning models will be offered during the open period of this challenge (March 2022 to September 2022), so this is more than a challenge but also a platform for developing and diversifying the next-generation (Geo)AI workforce.
This year, our focus is detecting craters on Mars’ surface, so we have named it the GeoAI Martian Challenge. This is to celebrate the anniversary of the successful landing of the Mars Perseverance rover on the red planet on February 18, 2021. We hope this event will promote the applications of cutting-edge AI technology in planetary and geospatial sciences, contribute to the exploration of future human life in space, and allow us to bring this experience back to Earth to study the changing environment of our living planet. In this object detection challenge, we have prepared Mars crater datasets that contain over 100,000 images and 300,000 craters located in nearly every corner of the Mars surface. Our goal is to encourage participants to develop novel GeoAI models for detecting the locations of craters on each image. The craters can be as small as ~100 meters in diameter or up to 2km in diameter. So, this is an interesting and challenging AI object detection problem. More information about the dataset and the details for the competition can be found here: http://cici.lab.asu.edu/martian.
This challenge is open literally to everyone who is interested in AI and geospatial sciences. Participants can be individuals or a team of AI fans. We especially encourage students, early-career scholars, women and underrepresented minorities to participate this event. We will select the top three solutions of the competition for a cash award (First prize: $500, Second prize: $300, Third prize: $200), a certificate as well as a generous gift from Esri. Selected participants will also have the opportunity to conduct internship in the CICI lab of ASU. We look forward to your participation!
Professor Wenwen Li
School of Geographical Sciences and Urban Planning
Arizona State University
Participation Overview
The challenge dataset is available here. It contains images, crater annotations, an evaluation program, and challenge-related files. Annotations of the training and evaluation sets are publicly available but those of the testing set will not be released. We will provide the means to evaluate models on the testing data through an evaluation server. The evaluation set with annotations is provided for debugging purposes, such as result format checking, submission testing, and result consistency checking between participants’ local machines and the evaluation server.
Participants are encouraged to develop systems built using any methods with the provided training data. The testing data must be used solely for reporting results. Any form of use of the testing data for training is strictly forbidden. The tuned models should then be run only once on the testing data. In order to finetune the model, the evaluation set can be utilized to evaluate the model during training. Participants can also divide the training data into multiple sets with strategies like n-fold cross-validation. The detection results of the testing set are submitted to an evaluation server on Codalab. Results must be in the correct format in order to be evaluated on the evaluation server. When submitting the results, please provide necessary information such that we are able to share your work on the leaderboard. Detailed information is introduced in the following sections.
Data Format
The data structure of the dataset is as follows:
2022 GeoAI Martian Challenge Dataset/
    --images/
        --000001.png
        --000002.png
    --ids.json
    --gt_public.json
    --gt_eval.json
    --evaluate.py
The images folder contains a set of images. Each image is a gray-scale image of size 256 × 256 pixels at 100 meter/pixel resolution. The filename of the image is a 6-digit number representing its image ID.
ids.json indicates image IDs for training, testing and validation sets. The data structure is a Python dictionary where the key is the set name (string) and the value is a list of image IDs in the corresponding set.
{"train": ["ID"], "test": ["ID"], "val": ["ID"]}
For example, ids["train"] is a list of image IDs in the training set.
gt_public.json contains annotations of the training and validation sets. Its format looks like
{
    "ID": [
        [xmin_1, ymin_1, width_1, height_1],
        [xmin_2, ymin_2, width_2, height_2]
    ],
    ...
}
It is a Python dictionary where the key is image ID (string) and the value is a list of crater bounding box (BBOX)
labels in the image. The label format is [xmin, ymin, width, height] and each value is an integer.
The coordinate system used in this challenge is shown in the figure below. The origin is at the top-left corner and
the positive y-axis goes in the downwards direction of the image. The (xmin, ymin) is located at the
top-left corner of the crater bounding box. This is also the most common image coordinate system. Participants could
access the annotations of the images from this file for model training.

gt_eval.json is used by the evaluation program. It contains the same annotations as gt_public.json. The only difference is its format is COCO data format. When performing the evaluation, this file should be placed under the same directory with evaluate.py.
evaluate.py is used for model evaluation. It generates evaluation metrics for the detection results.
Participants can either import the evaluate function from evaluate.py or execute it directly.
Detailed explanation is in the Evaluation.
Results Format
The detection results must be in a correct format in order to be evaluated locally or on the server. The result
format is similar to the file format in gt_public.json. It is a Python dictionary where the key is image
ID (string) and the value is a list of detection outputs. The detection output format is a list containing
[xmin, ymin, width, height, score]. Besides the location information, it also includes a confidence
score. The confidence score reflects how confident the classifier is about the detection. It should be a value
between 0 to 1. Detection results on different images are separated by the dictionary keys (image IDs). The data
structure of the result would look like:
{
    "ID_1": [
        [xmin_1, ymin_1, width_1, height_1, score_1],
        [xmin_2, ymin_2, width_2, height_2, score_2]
    ],
    "ID_2": [ ... ],
    ...
}
For an image without any crater detected, the result would be an empty list.
Evaluation Guidelines
To measure the performance of a model, participants can generate evaluation metrics on the detection results. This can be done either locally or on the evaluation server. To evaluate a detection result of an image, annotation of the image is required. Therefore, in your local environments, participants can perform evaluation on the detection results of the training set, evaluation set or the combination of them. Evaluation on any testing image will result in an error. On the server side, we provide evaluation on the detection results of the validation set and the testing set only. The evaluation metrics on the validation set can be used for submission or evaluation consistency tests because both sides can generate evaluation metrics on it.
On the local side, the python file evaluate.py in the dataset is used for evaluation. The function has one input: the detection results. The detection results can be either in a Python dictionary with the correct result format or a JSON file containing the dictionary. Participants can either import the evaluate function or execute evaluate.py directly.
- Import as a function.
- Execute evaluate.py directly.
from evaluate import evaluate

evaluate(detection_results)
$ python evaluate.py detection_results_file
The function will print out the evaluation metrics and return a list containing all values in the metrics used in this challenge. The metrics are the same as those used in the COCO detection challenge except for the definition except for the definition of object scales. Please refer to the detail of the metrics in the COCO detection challenge. In this challenge, small craters are defined as the area of the bounding box less than or equal to 10 by 10 pixels. Medium craters are the area of the bounding box greater than 10 by 10 but less than or equal to 50 by 50 pixels. And the rest are large craters.
**Average Precision (AP):**
AP          % AP at IoU=.50:.05:.95 **(primary challenge metric)**
APIoU=.50   % AP at IoU=.50 (PASCAL VOC metric)
APIoU=.75   % AP at IoU=.75 (strict metric)

**AP Across Scales:**
APsmall     % AP for small craters: area <= 10^2
APmedium    % AP for medium craters: 10^2 < area <= 50^2
APlarge     % AP for large craters: area > 50^2

**Average Recall (AR):**
ARmax=1     % AR given 1 detection per image
ARmax=10    % AR given 10 detections per image
ARmax=100   % AR given 100 detections per image

**AR Across Scales:**
ARsmall     % AR for small objects: area <= 10^2
ARmedium    % AR for medium objects: 10^2 < area <= 50^2
ARlarge     % AR for large objects: area > 50^2
Challenge Phase
There are two phases in the challenge: validation phase and main phase.
Validation Phase
Validation phase runs evaluation on the detection results of the validation set. The main purpose is to allow participants to test their GeoAI model’s training and testing flow, output formats, submission, evaluation, and other needed steps in this competition. For example, participants can test if the same evaluation scores (i.e., prediction accuracy) can be obtained when results are tested on one’s local server using evaluate.py as compared to the codalab server. The submission limit for the validation phase is 10 submissions per day and 100 submissions in total.
Main Phase
Main phase runs evaluation on the testing set (50,837 images). Once training is complete, participants can run the model on the testing set, generate predictions and upload the results to the evaluation server (main phase). The submission steps can be found in the next section. The evaluation metrics on the testing set are the primary standard used for ranking in this challenge. The submission limit on the main phase is two (2) submissions per day and six (6) submissions total.
Submission
Submitting results allows you to participate in the challenge and compare your results to state-of-the-art results on the public leaderboard. Note that the evaluation server only provides evaluation for the validation set (Validation phase) and the testing set (Main phase). Below introduces the steps for submitting results to the evaluation server:
- Create an account on CodaLab. Only one account for each team is allowed. Please add “team name” in your account settings.
- Find the GeoAI challenge through this link. Click on the "Participate" tab to register the challenge.
- Send an email request to geoai@googlegroups.com for approval. The email should use “Request for Challenge Approval” as the subject and include team name, member names, contact email, proof of identification, along with your CodaLab account. Check the next section for qualification.
- Prepare a folder containing your detection results and zip the folder. The results should be in a JSON file, and only one JSON file can be submitted for each submission. Check Results Format for the requested format on the detection result.
- Click on the “Participate” tab and select “Submit / View Results”. Choose an appropriate phase (validation phase or main phase), and then you will be given the option to submit new results.
- Click “Submit”. A pop-up window will prompt you to select the results zip file for upload. After the file is uploaded, the evaluation server will begin processing. To view the status of your submission, please click “Refresh Status”. Please be patient, the evaluation normally takes less than 5 minutes to complete.
- After you submit your results to the evaluation server, you can control whether your evaluation result will be publicly posted to the leaderboard. Only one result can be published to the leaderboard at any time.
- After the evaluation is complete, and the server shows a status of “Finished”, you will have the option to download your evaluation results by selecting “View scoring output log”.
Qualification, Rules, and Awards
This challenge is open to everyone who is interested in AI and geospatial sciences. Participants can be individuals or a team of AI fans. We especially encourage students, early-career scholars, women and underrepresented minorities to participate in this event. In this competition, each person can only participate in one team. Participants will be asked to provide proof of identification (i.e., student ID, professional webpage etc.). The best performing solutions are selected by the highest AP at IoU=.50:.05:.95 (refer to the Evaluation section for more information about the metric) on craters of all sizes in the testing set. To achieve a comprehensive assessment of participants’ solutions, additional supporting documents (e.g. technical report and a docker image of the trained model) will be required from the finalists. A virtual panel will be held for finalists to present their works and results. The top three solutions of the competition will receive a cash award (First prize: $500, Second prize: $300, Third prize: $200) with a certificate. The 1st prize winner will also be provided an Esri book of the winner choice. Books can be selected from the Esri Press. It can be a printed or an electronic book version. If the first prize winner is a team, each member of the team will get a book of his/her choice.
Leaderboard
1st
Team name: Imperial ACSEMembers: Yikang Wang, Cheng Yang, Yinze Li and Haowen Wang
Affiliation: Centre for Advanced Spatial Analysis (CASA), University College London
2nd
Team name: CSU-MoonMembers: Lina Xian, Lihong Li, Lingli Mu, and Gang Liu (last two are advisors)
Affiliation: Technology and Engineering Center for Space Utilization, Chinese Academy of Science
3rd
Team name: YangTze7Members: Changjiang Shi
Affiliation: Key Laboratory of Digital Earth Science, Aerospace Information Research Institute, Chinese Academy of Sciences
University of Chinese Academy of Sciences
GeoAI Martian Challenge Tutorial
Contact Us
For any technical questions (e.g., data, evaluation code, Codalab etc.) about our competition, please contact geoai@googlegroups.com.
For collaboration and sponsorship, please contact Prof. Wenwen Li at wenwen@asu.edu.
All our collaborators’ contact information can be found in the People tab.
Welcome to the 2022 GeoAI Martian Challenge!
The 2022 GeoAI Martian Challenge is the very first in the series of GeoAI challenges hosted by the Cyberinfrastructure and Computational Intelligence Lab (CICI) and the Spatial Analysis Research Center (SPARC) of Arizona State University (ASU). This is a collaboration among researchers from multiple disciplines, organizations and sectors, including ASU, U.S. Geological Survey (USGS), Jet Propulsion Laboratory (JPL), Oak Ridge National Lab, Esri, Google and American Geographical Society. The goal of this object detection challenge is to broaden the participation of, but not limited to, students and early career scholars in geospatial sciences, computer science, Earth and space sciences, data science, and fields relevant to this exciting research community. Through this challenge, we also hope to form a strong research network to facilitate collaboration among researchers and practitioners from different disciplines to jointly promote cutting-edge GeoAI research and education, as well as their translational solutions to problems in a wide range of environmental and social science domains. Virtual hands-on training sessions on designing and developing AI and deep learning models will be offered during the open period of this challenge (March 2022 to September 2022), so this is more than a challenge but also a platform for developing and diversifying the next-generation (Geo)AI workforce.
This year, our focus is detecting craters on Mars’ surface, so we have named it the GeoAI Martian Challenge. This is to celebrate the anniversary of the successful landing of the Mars Perseverance rover on the red planet on February 18, 2021. We hope this event will promote the applications of cutting-edge AI technology in planetary and geospatial sciences, contribute to the exploration of future human life in space, and allow us to bring this experience back to Earth to study the changing environment of our living planet. In this object detection challenge, we have prepared Mars crater datasets that contain over 100,000 images and 300,000 craters located in nearly every corner of the Mars surface. Our goal is to encourage participants to develop novel GeoAI models for detecting the locations of craters on each image. The craters can be as small as ~100 meters in diameter or up to 2km in diameter. So, this is an interesting and challenging AI object detection problem. More information about the dataset and the details for the competition can be found here: http://cici.lab.asu.edu/martian.
This challenge is open literally to everyone who is interested in AI and geospatial sciences. Participants can be individuals or a team of AI fans. We especially encourage students, early-career scholars, women and underrepresented minorities to participate this event. We will select the top three solutions of the competition for a cash award (First prize: $500, Second prize: $300, Third prize: $200), a certificate as well as a generous gift from Esri. Selected participants will also have the opportunity to conduct internship in the CICI lab of ASU. We look forward to your participation!
Professor Wenwen Li
School of Geographical Sciences and Urban Planning
Arizona State University