GCI: The Intelligent Geospatial CyberInfrastructure
Overview
This GCI portal provides a user-friendly and comprehensive Graphic User Interface(GUI) for remote users to add spatial dataset as OGC(Open Geospatial Consortium) Web Services for integrated visualization and spatial decision making. There are three types of OGC Web Service supported: WMS (Web Map Service), WFS (Web Feature Service) and WPS (Web Processing Service). We provide smart and convenient functions to help users discover online geospatial dataset resources. Together with powerful data integration, visualization and analysis components for data exploring.
Components in Home Page
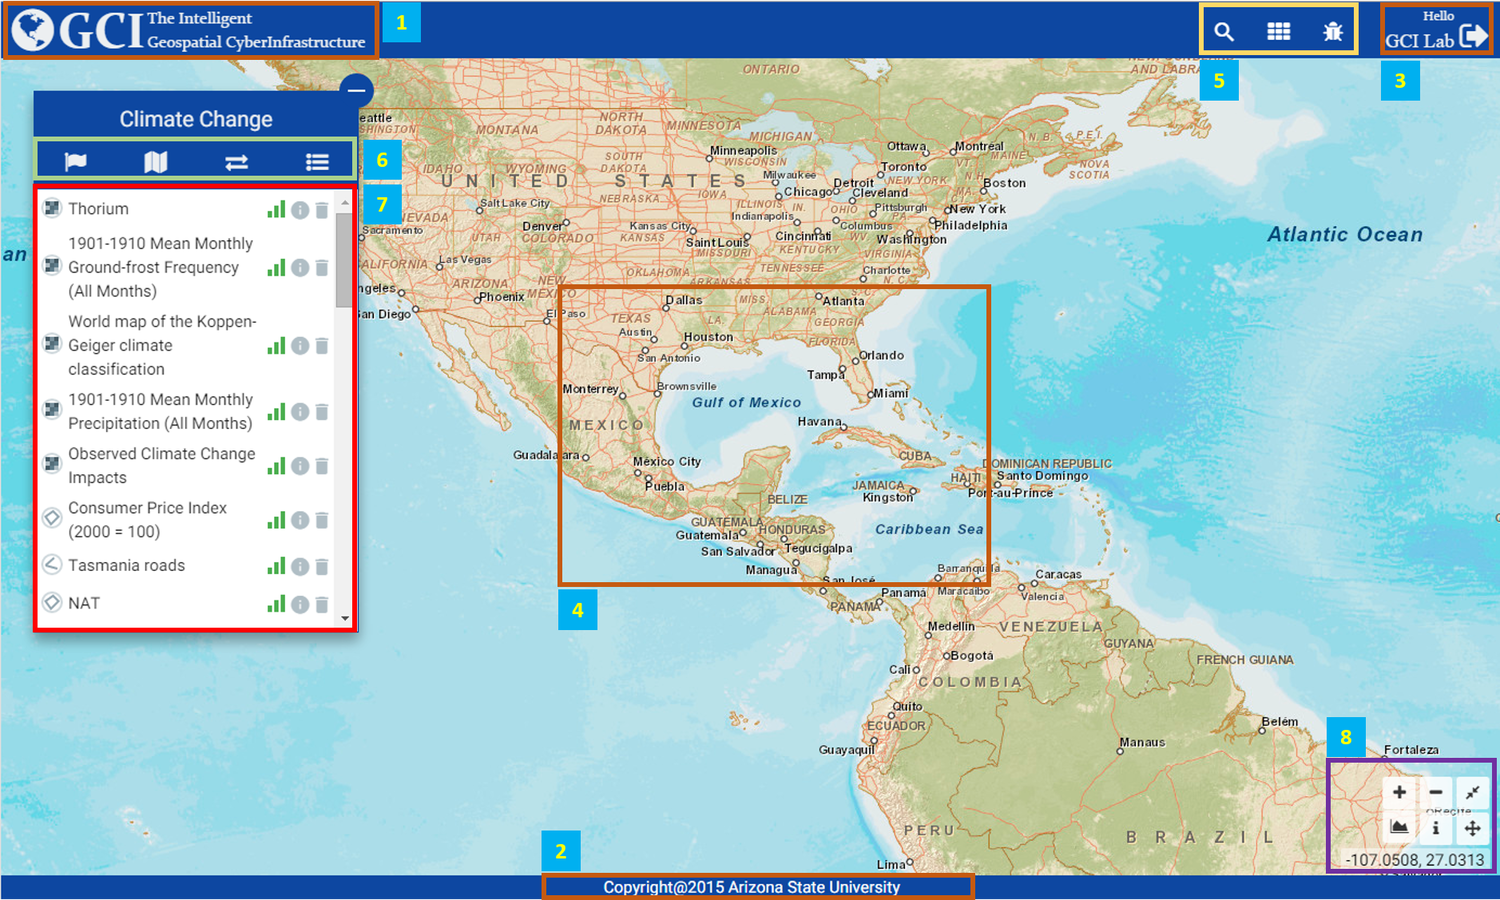
- Title Info
- Footer and Organization Info
- User Info When Login
- Map Panel
- Main Function Buttons:
- Layer Resource Search
- Data Analysis Functions
- Bug Report and Website Update Info
- Dataset Control Functions:
- Workspace Management
- Base Map Selection
- Show/Hide Checked Layer Panels
- Layer Management
- Layer Dataset Panel
- Map View and Visualization Panel Control:
- Zoom in
- Zoom out
- Zoom to Global Extent
- Open Statistic Result Visualization Panel
- Explore Feature Informations on the Map
- Move/Hide this Panel
- Cursor Position on Map
TIPS This website is designed to best adapt the Chrome and Firefox browsers.
User Management
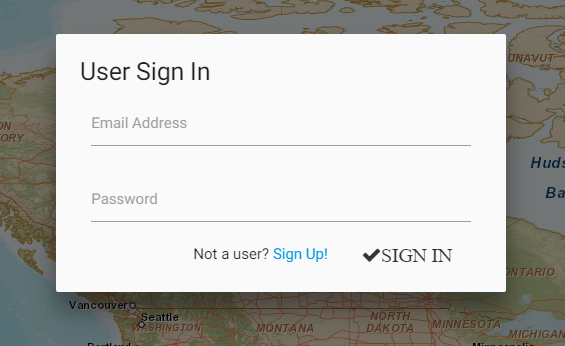
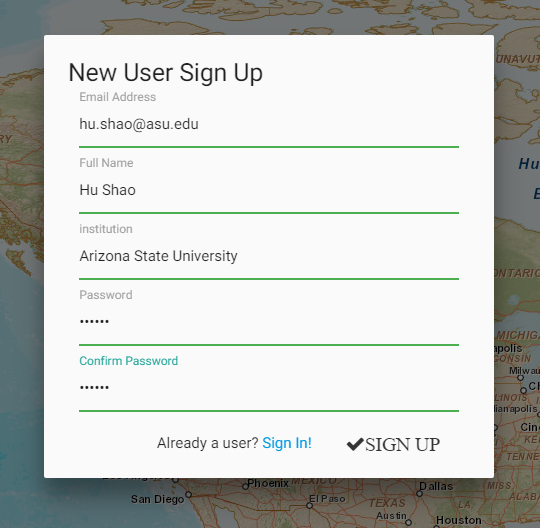
This website employ a simple user management system to help user store and control their own dataset. On the first time loading the website, there will pop up a log in window. For the new user, you can click the Sign Up link to switch to a sign up window for a new user registering.
Once registered or logged in, user's name will be presented at the upper-right corner of the main page. User can sign out anytime by clicking the Sign out button.
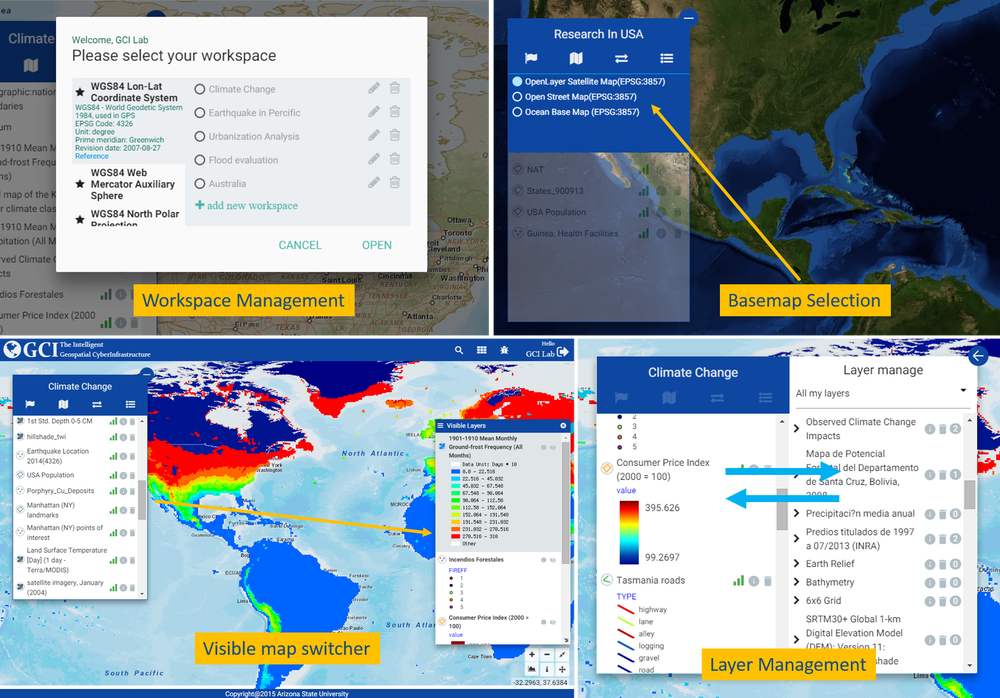
Workspace Management
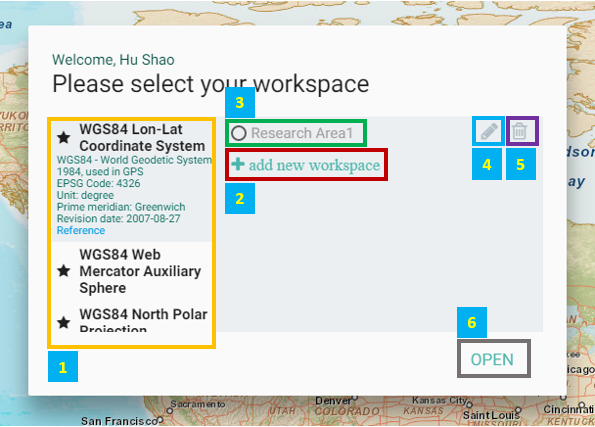
In our GCI portal, user could organize their layer dataset in different workspace. Once signed in, a workspace management window will pop up.
The workspaces are categorized by their belonging Spatial Reference Systems (SRS). We currently support 3 different SRS:
- WGS84 Lon-Lat Coordinate System (EPSG code: 4326)
- WGS84 Web Mercator Auxiliary Sphere (EPSG Code: 3857 900913 3587 54004 41001 102113 102100 3785)
- WGS84 North Polar Projection (EPSG code: 32661)
User firstly needs to select which SRS he/she will use on the left side of the window (box 1). Then all related workspaces of the selected SRS will be listed on the right side.
On the right side, user can add new workspace by clicking "add new workspace" (box 2), edit/rename an existing workspace (box 4) or delete a workspace (box 5).
Once a workspace is selected, click the "OPEN" button (box 6)to open this work space and load related data.
NOTE If a workspace is deleted, all records of the layer dataset in this workspace will also be removed.
TIPS Double Click a workspace tag can also open it. (box 3)
Geospatial Data Resource Discovery
Resource Search
One of the main functions of this portal is to help user discover geospatial data resource quickly and efficiently. We designed a specialized component to help users carry out such task.
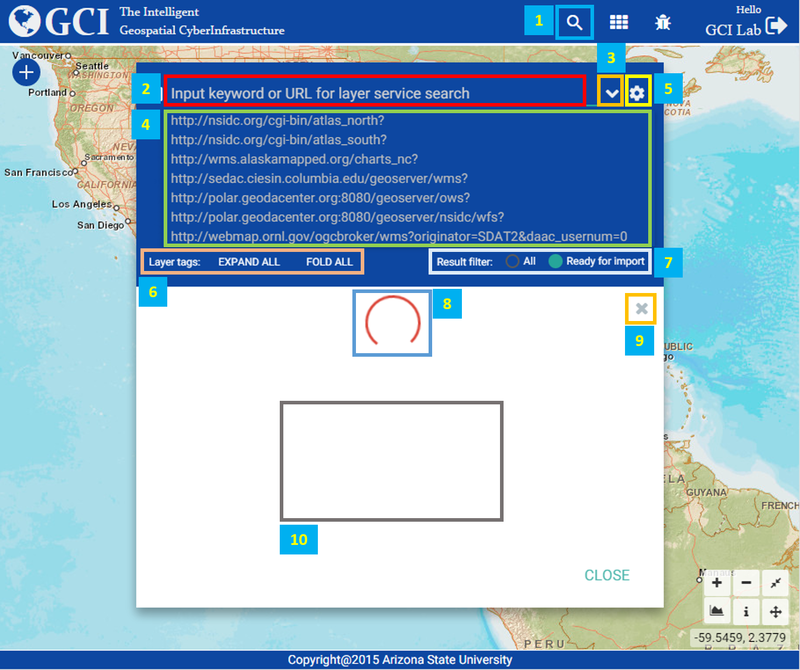
Click the search button on the upper-right corner on the home page to open the data resource search window. (box 1)
The textbox (box 2) in this window accept two kinds of input:
- Keyword of the resource you want to find (e.g. climate, ocean, ice etc).
- URL of a OGC WMS or WFS service (e.g. http://polar.geodacenter.org:8080/geoserver/ows?)
After inputting is finished, click "Enter" to trigger the search process. The system will detect the type of input and select appropriate search method. If the input is keyword, the system will search our background database to find matched data resource. The background database is prepared by another project of ours, the PolarHub. If the input is URL, the system will directly retrieve dataset information from the server through some standard protocols.
We provide some alternative server urls for users to choose. click the button on right side of the input box (box 3) to pop up url list panel (box 4).
TIPS You can also pop up url list panel (box 4) by double click the input box (box 2).
Once the layer search task begins, there will present a loading icon (box 8) in the blank space, meaning that there is a task on going. During this period, no new search task could be conducted. After about 10 seconds, there will present another close button (box 9) on the right side of loading icon. By clicking this button, you can terminate the search process immediately and begin a new search.
NOTE The search process may take up to 1~3 minutes according to the size of the file needs to be downloaded on the server side and the network environment. Please be patient during this process.
Search Result
Result of Geospatial Data Resource Discovery will be presented on the blank space to users for viewing and exploring.
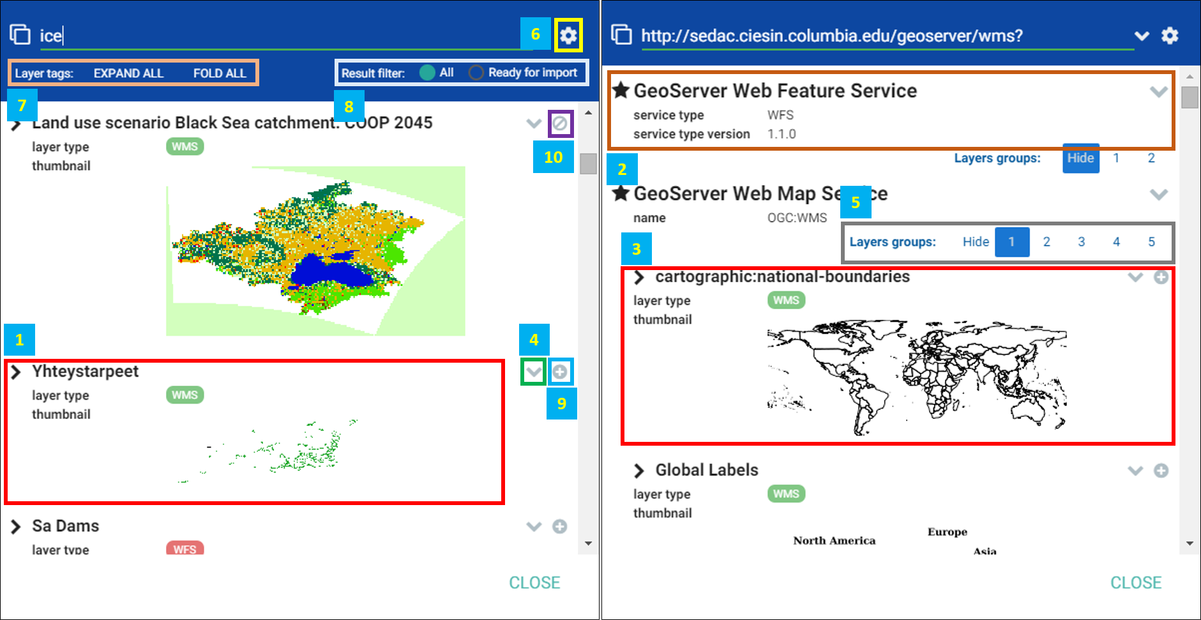
Search results by keyword will be organized by layer. Each layer will be presented as an element (box 1).
While search results by URL will firstly be aggregated by their different service type (box 2)(e.g. WFS or WMS). Then, they will also be presented layer by layer (box 3).
Details of each layer will be hidden by default. Click the button on the upper-right corner (box 4) of each layer tag to show/hide details of the layer dataset.
The number of layers retrieved by URL might be very huge. We designed a pagination component to manage the layers (box 5). You can jump to any specific page or hide the page by click the button (box 5).
If you click the configure button (box 6) on the upper-right corner of the window, their will present some present control functions. You can select to show/hide the detail of all layers by clicking the button in box 7.
Not all the result layers are good to be added to the current workspace. The layers which have inconsistent SRS or are lack of of some key parameters will be forbidden from been added to the map (box 10). The "good" layers can be directly added to the map by clicking the button on the upper-right corner (box 9). You can also choose to show/hide the "bad" layers in box 8.
Layer Management
Layer Management Panel
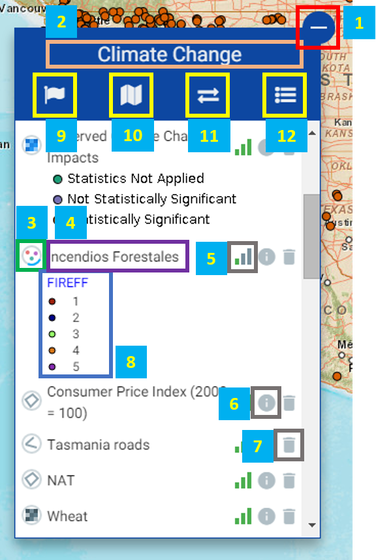
The panel on the left side of the main page is designed to manage all layers in a specific workspace.
Clicking button in box 1 could show/hide this layer management panel.
Text in box 2 is the name of current workspace. Double click the text could trigger the function of editing workspace name
Each layer dataset is presented as an independent element in the panel.
At the left-most side is the icon (box 2) of each layer. Four different icons are designed to indicate the layer type, which are:
- Raster layer (WMS)
- Vector layer, point type(WFS)
- Vector layer, line type(WFS)
- Vector layer, polygon type(WFS)
Click the icon to show/hide each layer. If a layer is visible, the icon will be presented as colorized. Otherwise, the icon will be monochrome. There will be a arc spinning on the icon during the data caching process (box 3). The title of each layer is presented by the right side of layer icon (box 4). You can drag and move the layer element upward or downward to adjust the layer order. The layer element order in this panel is consistent with the layer order presented in the map. On the right side of each layer title, there are three icons:
- Check service quality(box 5). This icon indicates the general quality of each layer dataset service. We also have a score ranging between 0 and 100 to evaluate the quality. Low quality means the average data acquisition time might be longer.
- View metadata of the layer(box 6). By clicking this icon, you can see the detailed metadata of the layer in a new window.
- Delete the layer(box 6). Clicking this icon will remove the corresponding layer from current workspace and map.
NOTE By clicking the delete button, the layer will be deleted from current workspace, but this layer may also exist in other workspace. So, the record will not be removed from your background database. You can permanently delete a layer in the layer management component (box 12).
When a layer is checked (visible), the legend of the layer (box 8) will be presented beneath the layer title. We also designed a powerful layer symbol management tools to help user adjust and manipulate the layer symbol. We will introduce this in another section.
Auxiliary Layer Management Tools
We provide another 4 auxiliary layer management tools to help users efficiently manage their layer dataset. The accordingly buttons are placed under the title of workspace(box 2):
- Workspace management(box 9): By clicking this button, you can open the workspace management window, edit and switch the workspace anytime.
- Basemap selection(box 10): We provide multiple basemaps to help users better understand the context of their study area. By clicking this button, you can select appropriate basemap from a popup list.
- Visible map switcher(box 11): A workspace may contain multiple layers. To help users better organize their layers, we developed this function. By clicking this window, the system can switch all checked(visible) layer into a new window. Legends in the original window will be cleaned.
- Layer Management(box 12): By clicking this button, the layer management panel will expand and the layer management function will be presented in the new area. At the top of the window is a dropdown list which contains all other workspaces under the same SRS category, together with a virtual aggregated group: All my layers which contains all layer dataset from other workspaces. Select one workspace, the layers of this workspace will be listed below. You can drag and drop layer elements between current workspaces and other workspace to directly copy layer dataset (after drop, the layer dataset in previous workspace will not be deleted).
TIPS In the virtual "All my layers" workspace, there will be an extra icon on the right side of each layer element indicating this layer exists in how many workspaces. If you delete a layer in this virtual workspace, this layer's record in database and all its existences in other workspaces will be permanently removed.
NOTE Once triggered the layer management function, other functions will be forbidden until this function is turned off.
Layer Symbol Management
The layer symbolization management component designed in this system is intended to help users quick set beautiful symbols according to the rich information contained in the layer datasets' attribute table. By the exploranatory visual analysis of online dataset, we hope users could gain better insight of their study area.
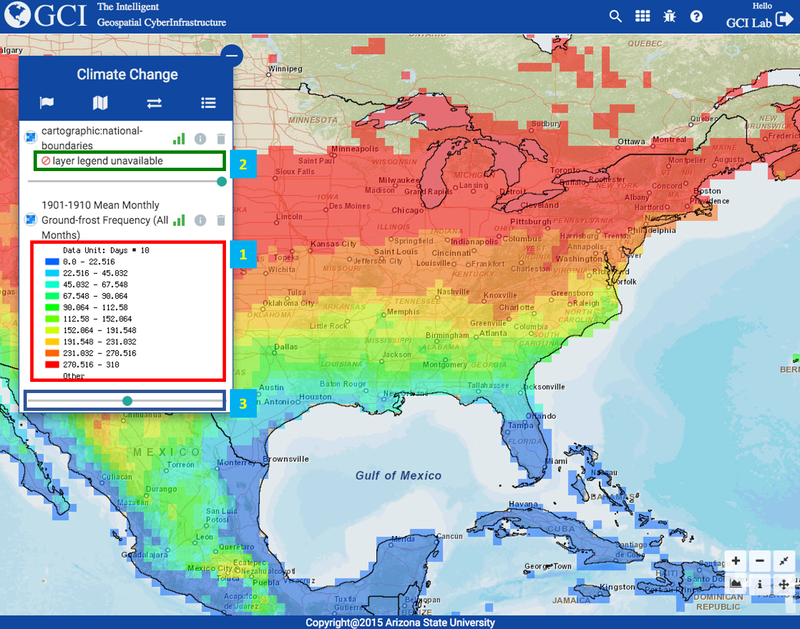
WMS Layers
For WMS layers, when the layer is checked(visible), there will be a legend(box 1) showing below its title. By clicking the legend, you can trigger the opacity setting widget (box 3) for the WMS layer. In this widget, you can set the opacity of the layer. The opacity of each layer was set as 100% by default.
TIPS For the layers whose legend are unavailable, you can also click the "layer legend unavailable" mark to open/close the opacity setting widget. (box 2).
WFS Layers
The symbolization system for vector layers are a little bit complicated but more powerful. For different vector layers, their customizable items are different.
Point layer
1.Size*
2.Fill color*
3.Stroke color
4.Stroke width
Line layer
1.Stroke color*
2.Stroke width*
Polygon layer
1.Fill color*
2.Stroke color
3.Stroke width
The items with * means they could be dynamically set as different values according to the layer's feature attributes. (e.g. set the color of a point layer according to the attribute of the layer).
NOTE for a layer, only one term can be set as dynamic (e.g. when the size of a point layer is set as dynamic, the fill color can only be set as simple).
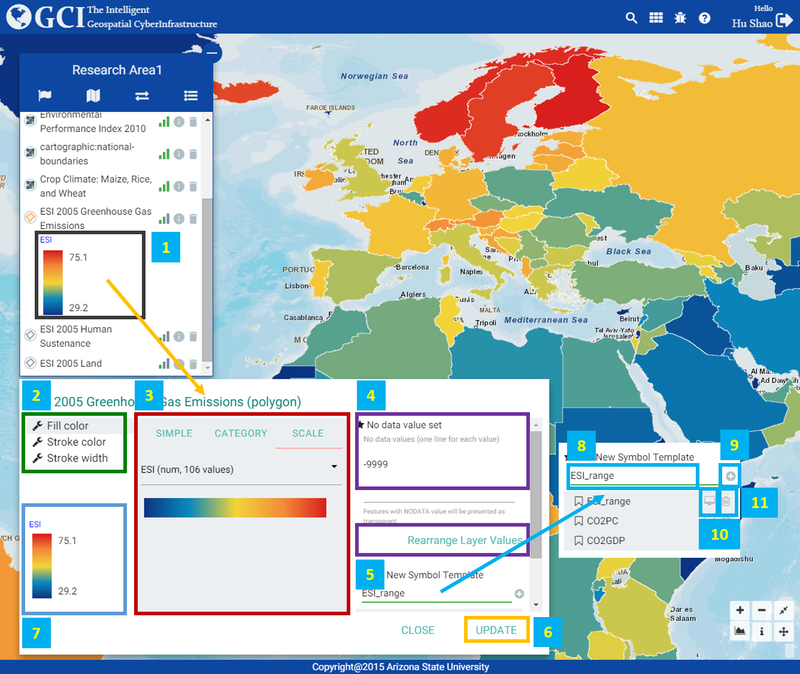
The symbolization component window can also be opened by clicking the layer's legend (box 1).
At the upper-left part of the window, there is a list of customizable symbol items (box 2) of the selected layer. Click the item, contents at the center of this window will be changed accordingly (box 3). You can change the presenting attributes of an item at this place. There are 3 different kind of setting modes you can select:
1.Simple: set a single value for an item.
2.Category*: set different values for an item according to layer's field attribute.
3.Scale* set gradually varied values for an item according to layer's field attributes (the field attributes must be numerical).
The category and scale are complex modes. When you select to use these modes, the system will first scan all attribute values of the layer's fields, detect suitable fields which can be used for setting these complex modes, then present the field names in box 3
Under the circumstance that there are some "NoData" value contained in a field, you need to explicitly input them in box 4. Then press Rearrange Layer Values button (box 5). The system re-scan and analyze the layer field values but filter the NoData values.
After setting all items, press the UPDATE button (box 6). The layer symbol will be updated at the bottom-left side of this window (box 7) and on the map.
TIPS We also provide you another tool to help you store multiple symbol schema of a layer in a place and switch among them quickly: After updating the symbol, you can name the symbol in box 8 and press the save button (box 9) to save the symbol in a list below it. Then you can press the display button (box 10) to quick apply the saved symbol schema or press the delete button (box 11) to remove the symbol schema from the list.
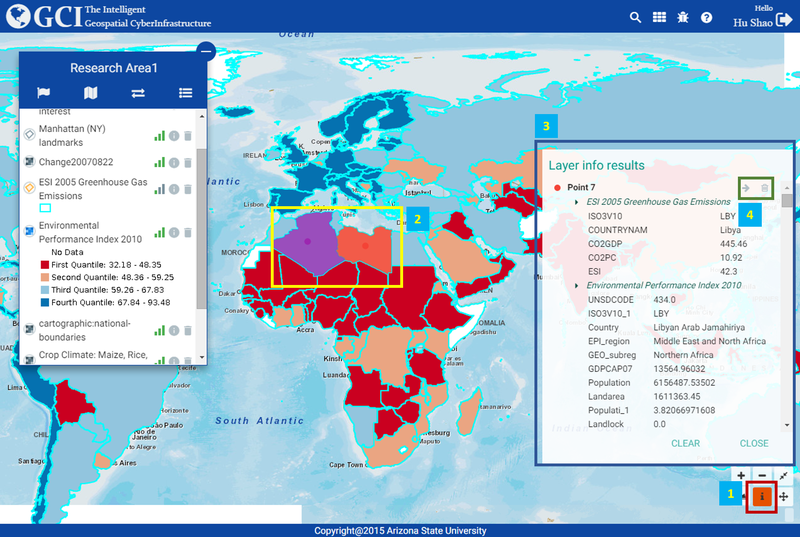
Map Information Check
We provide this tool to help users check the information at their interested location:
Click the information button (box 1) at the bottom-right corner of the main page to open the information check window (box 3).
Click any location on the map (box 3), their will be a new point added to the map. The system will check all currently visible layers at this location, then presents their aggregated layer information in the information window (box 3). There will be two buttons at the right side of each point (box 4):
1.Quick move the map center to this point.
2.Remove this point from the map.
When you close this window, all points will be removed from the map.
Additional Functions and Tools
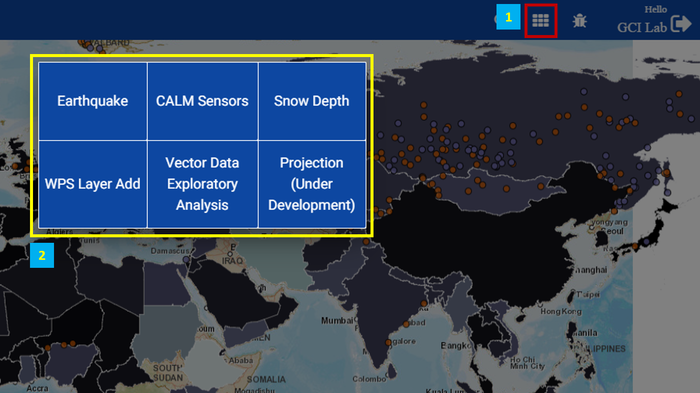
Many additional, experimental and under developing functions and tools are also provided in our Portal. To open them, click the button (box 1) at upper-right corner of the main page. There will popup a grid-list (box 2) which contains all functions for you to select.
We currently provide 5 functions/tools:
1.Earthquake Analysis
2.Climate Change Sensors' location find
3.Snow Volume Analysis
4.Local Moran's I Analysis of Economic Factors
5.Vector Data Exploratory Analysis
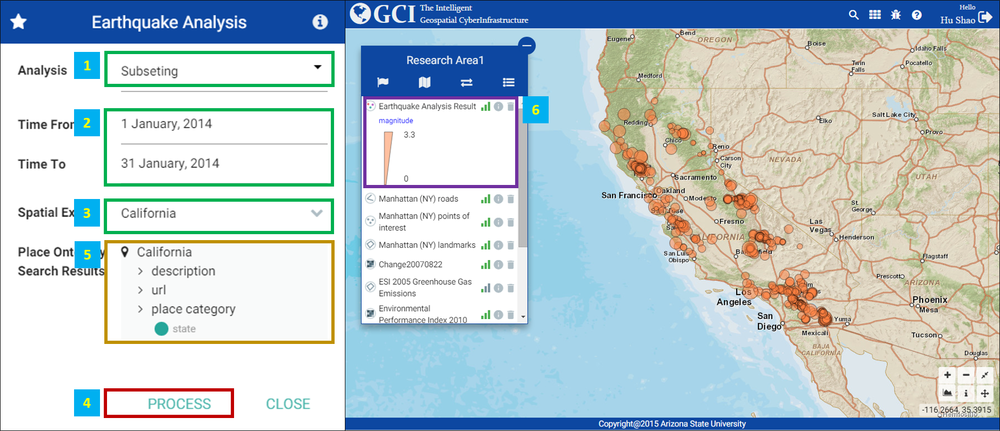
Earthquake Analysis
This component is designed to answer the questions like: How many earthquake occurred in the states of California,Utah and Alaska during 01/01/2014 and 01/31/2014?
- After opening the window, select the analysis type from box 1.(We recommend "Subsetting")
- Set the begin and end time of your analysis(box 2).
- Input the names of places for your analysis(box 3). You can also select the names from a popup list by clicking the arrow button on the right.
- Press the "Process" button(box 4), our system will automatically analyze your input place names by using some semantic technology. The analysis result will be presented in box 5 for you to double check.
- If everything is OK, Press the "Process" button(box 4) again to execute the analysis process.
- After a while's WPS analysis on the background server, an new layer will be returned as the result(box 6).(The result will be presented with simple symbol. But you can customize the symbol by using the symbolization tools we have provided).
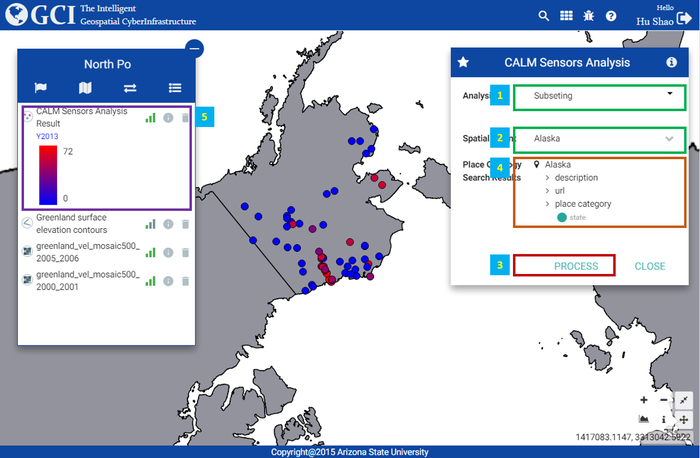
Climate Change Sensors' location find
This component is designed to answer the questions like: How many CALM Sensors are located in Canada, Russia, Norway and Greenland?
- After opening the window, select the analysis type from box 1.(We recommend "Subseting")
- Input the names of places for your analysis(box 2). You can also select the names from a popup list by clicking the arrow button on the right.
- Press the "Process" button(box 3), our system will automatically analyze your input place names by using some semantic technology. The analysis result will be presented in box 4 for your double check.
- If everything is OK, Press the "Process" button(box 3) again to execute the analysis process.
- After a while's WPS analysis on the background server, an new layer will be returned as the result(box 5).(The result will be presented with simple symbol. But you can customize the symbol by using the symbolization tools we have provided).
NOTE This function currently can only be executed under the SRS of EPSG:32661 (UPS North Pole Projection). Please switch to a workspace with the EPSG:32661 SRS before using this function.
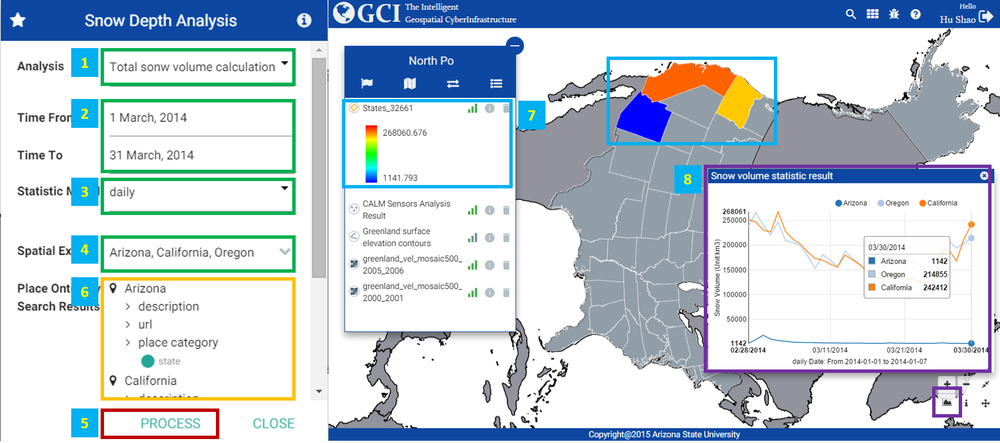
Snow Volume Analysis
This component is designed to answer the questions like: What are the variations of snow volume in Wisconsin, New York, Minnesota, Colorado in the first three months of 2014?
TIPS We recommend you to add a WFS layer named States_32661 from our server http://polar.geodacenter.org:8080/geoserver/ows? before the analysis. The returned results will be visualized based on this layer.
- After opening the window, select the analysis type from box 1.(We recommend "Subseting")
- Set the begin and end time of you analysis (box 2).
- Select the aggregate unit for your analysis as daily or weekly (box 3).
- Input the names of places for your analysis(box 4). You can also select the names from a popup list by clicking the arrow button on the right.
- Press the "Process" button(box 5), our system will automatically analysis your input place names by using some semantic technology. The analysis result will be presented in box 6 for your double check.
- If everything is OK, Press the "Process" button(box 5) again to execute the analysis process.
- After a while's WPS analysis on the background server, the result will be presented based on the layer "States_32661"(box 7). There will be another window contains the statistic charts of the result (box 8). Move your mouse on the chart, the color on the layer will dynamically changed accordingly.
NOTE This function currently can only be executed under the SRS of EPSG:32661 (UPS North Pole Projection). Please switch to a workspace with the EPSG:32661 SRS before using this function.
Bug Report
Any comments for our GCI portal are very welcomed. We developed an specific bug report panel for users to leave comments to us.
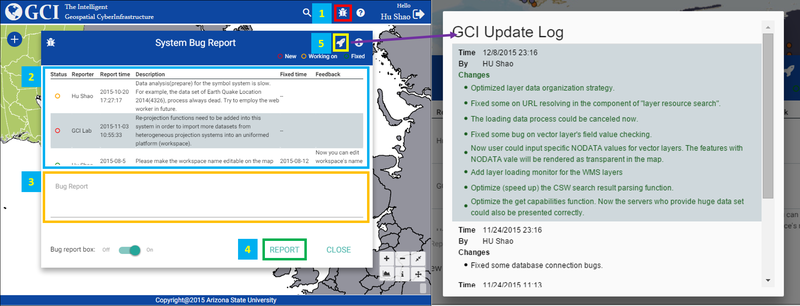
Click the "Bug" button (box 1) at the upper-right corner of the main page. The panel will be opened. In the window. Their will be a list showing all reported bugs' information and comments(box 2).
You can also report your own bug in box 3. Then click the "REPORT" button (box 4), the comment will be immediately uploaded to the server. The list will also be updated.
Click the "Rocket" button on this window(box 5), their will popup a system update log for you to read.